Category Archives: Insights

Understanding Investment Expenses and the Cost of Advice

It is a good idea to understand how much you are paying your advisor and the investment managers who manage your money, so that you can evaluate the value you are receiving for money paid. There are generally three types of costs associated with investing:

• Investment management fees: if you own mutual funds, Exchange Traded Funds (ETFs), segregated funds, a work RRSP or a defined contribution pension plan, there is a management company in the background making decisions about what stocks and bonds to buy or sell on your behalf. These managers (for example Mackenzie, Fidelity, Sun Life, RBC) charge a fee which is usually disclosed in Fund Facts documents and marketing materials, but is not otherwise visible. The fee is charged on the total value of the money you have in each fund, and is deducted monthly. It typically ranges from 0.1% up to 1.5% per year. A lower fee is not always better. What you should look for is the best after-fee returns for a given level of risk. One manager may charge a higher fee than another, but uses those fees to hire the best analysts, top-tier managers and has offices and researchers in other parts of the world, which allows it to earn higher returns, even after fees. Another manager may focus on earning steady returns with low down-side risk. Their fees are justified by providing you with greater peace of mind.

• Institutional costs: there are many institutions in Canada which sell investments (for example HollisWealth, CIBC, Manulife, Investors Group, Scotia McLeod, Edward Jones, etc.) The institution you are with is responsible for providing you with statements, online access to your accounts, contribution receipts and tax statements. They also process transactions in your account, make sure that your accounts comply with securities regulations and ensure that your advisor is licensed and qualified to advise you about your investments. Most institutions have proprietary investment portfolios. Their investments may be managed by their own investment managers or they may select a number of external institutional managers to manage different parts of the portfolio (bonds, Canadian equities, Global equities, etc.) Your institution may charge you monthly and/or annual fees, and/or charge commissions for transactions. They may also receive commissions and ongoing service fees from mutual funds.

• Advice: brokers, mutual fund advisors, bank employees, insurance agents, and financial planners offer different levels and types of advice on investments, tax planning, estate and retirement planning. Unless you are a do-it-yourself investor, your financial advisor is probably the most important point of contact with the investment world. He or she is responsible for understanding what your goals and objectives are, developing and implementing tax strategies, investment plans, estate planning, retirement income planning and risk management. Advisors also meet with, research and evaluate the managers who look after your money and/or research and recommend individual stocks. Fee-only planners charge you a fee directly for their financial plan and asset allocation advice, and refer you to an investment manager for the day-to-day management of your investments. Advisors and brokers are paid a portion of the fees charged by your institution. Insurance agents and bank employees may earn a mix of salary, commissions and/or bonuses, depending on what products they sell.

Even if it seems that you are not paying anything to have your investments managed, you can be sure that the people working on your behalf are not working for free. Understanding how much you are paying, and to whom, is the first step in making sure that you are getting good value for the money you spend.

Finding out is as easy as asking your advisor the question: “How much am I paying to you, to my institution, to the managers who manage my money?” Once you know what your costs are, the next step is to look at the value you are receiving. How has your performance been relative to a benchmark? Are you receiving financial planning, tax advice, information about your investments, good client service, etc. But that’s a topic for another blog…

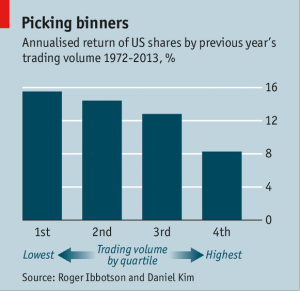
The Most Popular Stocks Don’t Necessarily Outperform

A study by Roger Ibbotson and Thomas Idzorek, “Dimensions of Popularity”, published in the Journal of Portfolio Management, Vol. 40, No. 5, 2014 shows that the most popular stocks as measured by trading volume underperformed the least popular stocks by 7% over the following year.

The stocks were divided into quartiles (top 25%, second 25%, etc.) over the period from 1972 to 2013 and the authors looked at price changes in each group over the next year. They found a correlation between the popularity of stocks (as measured by share turnover) and their return one year later. The less popular stocks performed better, suggesting that when investors jump on bandwagons, they often push stock prices higher, with less potential for further appreciation.

The authors theorize that less popular stocks may be perceived by investors as being less liquid, more risky or less likely to grow, causing mispricing and opportunities for buyers willing to not follow the herd.

Does it make sense for you to go out and buy unpopular stocks? Perhaps, if you are willing to do some homework to evaluate the fundamental characteristics of the stock you are buying. Stocks are often out of favor for a good reason, so it makes sense to do careful research before making any investment. If you do not enjoy or do not have the skills to do this type of research, a good alternative is a mutual fund whose manager has a high ActiveShare rating (see my blog entry September 13, 2013).

Why I’m cautious about using ETFs these days…

ETFs (Exchange Traded Funds) are the hottest segment of the investment market lately. For years, more money has been flowing into ETFs than actively managed mutual funds. They are being used by pension funds, robo-advisors, brokers, asset allocation programs and millions of individual investors, who like their low fees, their flexibility for moving in and out of markets quickly and their ability to give performance that is very close to market returns by replicating various indexes.

I am largely an optimist about equity investing, and rarely buy into doom-and-gloom scenarios. However, I have two major concerns about ETFs in the present environment.

  1. The first concern is structural, and has to do with crowd behaviour in a crisis. In a major market sell-off, ETFs could face significant redemptions. Many investors use ETFs as short-term holdings, and ‘hot money’ tends to flow in and out. In a crisis, cascading sales could add selling pressure to all stocks but especially the weaker and pricier stocks in the index. It is possible we could see something new: dozens of stocks going ‘no bid’, where there are literally no buyers for large volumes of many stocks. Market regulators will most likely suspend trading in these securities, and when trading resumes, the crash in those overpriced stocks could drag down the value of the indexes and their corresponding ETFs by a surprising amount. Investors who thought their ETFs were ‘safe’ could be shocked and financially damaged, especially if they panic and sell during the crisis.
  2. My second concern is more long-term. ETFs allow people to buy indiscriminately, buying good stocks and bad stocks without really looking at their price or their true value. This is probably contributing to the current high valuations in many indexes. I am reminded of the ‘Nifty Fifty’ stocks on the U.S. stock exchanges in the ‘60s and ‘70s. These stocks were considered solid, Blue Chip investments and it was widely believed that you couldn’t go wrong owning these stocks. They were bought by so many investors without much regard to price that valuations reached unsustainable levels. When the bubble burst for the Nifty Fifty, it took fifteen years for them to get back to their previous peak. I am afraid that something like this will happen to the more popular indexes, and the ETFs that replicate them.

In investing, following the herd can be one of the costliest mistakes an investor can make. I am still comfortable using short-term bond ETFs, and may look at equity ETFs again in the future. If they disappoint millions of investors and fall out of favour, I will likely be happy to buy them. Until then, I prefer to invest my own money, and that of my clients, with the very best active managers I can find and a select few stocks that are not widely followed by analysts and brokers. I like low fees as much as the next person, but in this case, I think paying a little more for fundamental analysis and active management will save a lot of heartache.

Six Lessons We Can Learn From the Oil Crisis

Market crises like the oil crash can remind us of valuable lessons:

  1. The market changes abruptly. Never count on analysts and economists to call a major turn in the market. It’s unpredictable, can happen fast and there’s too much career risk in guessing it wrong.
  2. The market is cyclical; just about everything is affected by economic activity and changes in supply and demand. Remember to zoom out and look at the larger patterns.
  3. Always diversify. Too many investors diverge from their diversified asset mix and jump into trends, but making a bet on a secular or cyclical trend has to be done in the context of a diversified portfolio.
  4. Focus on full cycle returns, not 3 or 4 year runs. As Warren Buffet has said, “You only find out who’s swimming naked when the tide runs out.” Make sure your CEOs and portfolio managers are fully clothed at all times.
  5. The highest yielding stock is not necessarily the best investment. Dividends aren’t a risk control measure, nor are stock yields a valuation tool. For dividend investors, the path to good returns at a reasonable risk is not the highest yield but rather a portfolio of dividend-paying stocks trading at or below what they’re worth.
  6. The market is prone to overreacting to short term news and economic trends, resulting in low valuations and more importantly, opportunity. Crises are invaluable for strong returns for those with the discipline to buy low and sell high.

Credit to Tom Bradley’s Absorb these six lessons from oil’s collapse, Globe and Mail, 17 Feb 2015

More Equal Than Ever

In a good article in the Washington Post, Maryan L. Tupy looks at income inequality around the world and concludes that globalization “has ushered in a period of unprecedented prosperity” around the world. Tupy is a senior policy analyst at the Cato Institute’s Center  for Global  Liberty and Prosperity and editor of Humanprogress.org. Key takeaways:

  • In the U.S. the income gap between the richest 1% and the rest has grown. But if we look around the world, inequality is shrinking, not growing. In the words of the World Bank’s Branko Milanovic, we are witnessing “the first decline in global inequality between world citizens since the Industrial Revolution”.
  • By the early 1800s the U.S. was 1.9 times richer than the global average. By 1999 that gap had risen to 4.8 but it has since shrunk to 3.9 as the rest of the world began to catch up. That narrowing of the gap is not due to declining U.S. incomes as U.S. GDP per capita has rebounded and now stands at an all-time high.
  • The catch-up is most dramatic in China. Mao’s collectivization of agriculture resulted in famine which killed between 18 and 45 million people. Following liberalization in 1978, GDP per capita increased 12.5 fold.
  • Improvements in life expectancy, child and maternal mortality, treatment of communicable diseases and the spread of technology have resulted in a dramatic narrowing of the standard of living gap. As Laurence Chandy of the Brookings Institute wrote in 2011, “poverty reduction of this magnitude is unparalleled in history: never before have so many people been lifted out of poverty over such a brief period of time.”
  • Many Americans point to globalization as a bogeyman, but the phenomenon has ushered in a period of unprecedented prosperity in many poor countries. “… let us remember the global – and largely positive – perspective on the state of the world.”
  • My own thoughts about this are that if we focused less on the differences between the 1% and the 99%, and more on the similarities, we would feel a lot more grateful for what we have. If we measured equality in terms of quality of nutrition and health care, access to information, education, shelter, entertainment and transportation we would see enormous improvements in equality over the last 200 years. Let’s face it, most of the 99% today live better than – and longer — than the kings of centuries past.

Are Buyers of Mutual Funds Suckers?

National Post columnist Andrew Coyne thinks buyers of mutual funds are suckers, as are the members of the Canada Pension Plan Investment Board, for embracing active management. He argues that up to three quarters of actively managed mutual funds have under performed their benchmark indexes after fees. He also says that the CPPIB has spent $9 billion on hiring outside active managers and added only $3 billion in performance over the benchmark index over the last seven years, for a net cost to taxpayers of $6 billion.

He is persuasive, and like other columnists thinks owners of mutual funds are suckers for paying high management fees. It’s enough to make an investor or advisor who uses these products feel like a chump.

Here’s where Andrew Coyne is wrong:

  • It’s totally irrelevant that there are thousands of mutual funds that have under performed their benchmark indexes. To use a timely analogy, just because 90% of professional soccer players will never score a goal in the World Cup doesn’t mean there are no superstars who are worth the millions they get paid. The best mutual fund managers and pension fund managers earn their fees by picking the best stocks and leaving out the dogs. Think Kim Shannon, Gerald Coleman and Alan Radlo – who along with others in the top tier have a long history of outperformance. It’s a good advisor’s job to research the best fund companies, meet the managers and do the due diligence that will allow them to pick the best funds for their clients.
  • Sometimes it’s not all about returns. Investors use mutual funds to reduce risk. Pension boards use active management for the same reason. How much is a 10% reduction in volatility worth, in a $189 billion dollar pool of pension assets? $1.75 billion per year? More? Less? It’s a judgment call. Some of my favourite mutual fund managers have matched or come close to their benchmarks with much less volatility than the index. Investors who buy these funds are looking for the peace of mind that comes from preservation of capital — avoiding bankruptcies or the latest fad (think Nortel, Bre-X, WorldCom and Enron) and not having to live through huge declines when the markets tank. I look at upside/downside capture ratios to find managers who smooth out the roller coaster by declining less than the indexes when the markets go down and capturing most of the upside when the markets go up.
  • Investing is complicated, and part of the fee mutual fund owners pay for the management of their money goes to the advisors who help them build their portfolios and avoid behaviour that creates losses. Mr. Coyne advocates a portfolio of low-cost ETFs. What he doesn’t say is that studies show that do-it-yourself investors on average earn much less than the indexes, because they often buy and sell at the wrong times. The average ETF is only held for a few months, showing that investors who use them are mostly speculating, rather than using them as part of a long-term, disciplined investment strategy.

Where Andrew Coyne is right:

  • Investors (and the CPP investment board) need to hold their managers to a high standard. Managers need to be compared to a benchmark, and fired or changed if they are not adding value by either improving returns or reducing risk. Investors should set up (or ask their advisors to set up) a #personal benchmark (see my blog entry about #personal benchmarking) that allows them to measure how their managers and their advisor are doing.
  • An investor who buys a mutual fund that simply replicates an index is paying high fees for little or no value. These fund managers are closet indexers, and do little to earn their fees. An ETF or smart index fund would be a better choice than closet indexer. But managers who are not afraid to look different from the index, stock pickers who have a high ActiveShare rating, have been shown by research to add value over and above their fees (see my blog on ActiveShare ratings).

The bottom line:

ETFs can be an effective way to reduce costs as part of an overall strategy that includes active management and low-volatility funds. However, Mr. Coyne is contributing to a culture of condemnation of advisors and mutual funds by the media that has the potential to do harm to millions of investors. Columnists like Mr. Coyne who are unaccountable to the readers who follow their advice are doing Canadians a great disservice by urging them to give up their advisors and their fund managers to follow a do-it-yourself strategy that focuses mainly on fees. Calling buyers of mutual funds suckers is good copy and may sell newspapers, but it will do more harm than good. For shame, Mr. Coyne!

Risk for Investors in Emerging Markets

I had the opportunity last night to attend a dinner and talk in Montreal with Myles Zyblock, Chief Investment Strategist for Dynamic Funds and David Fingold, manager of several of my favourite Dynamic global funds. As an aside, the dinner was excellent; Europea was the restaurant; the service was top-notch, and the chef created many whimsical appetizers and dessert bites which were presented with great artistry and showmanship. In the informal presentation and discussions that followed, I gained some insights into their ideas about the global risks and opportunities facing investors today. My most important take-aways:

  • The huge growth in China and other emerging markets from manufacturing and infrastructure spending is slowing and will continue to slow in coming years. Emerging markets debt poses a little-known risk for investors as some of the world’s fastest growing countries shift their economies towards greater domestic consumption as a share of GDP. When Japan and South Korea did this, the result was ten to fifteen years of declines and stagnation in their markets.
  • The assets that investors are buying today for safety have much greater risk than they think. These include bonds, high-quality high pay-out stocks with little growth, as well as many REITs, utilities and defensive stocks.
  • The 20% of fund managers who have High ActiveShare ratings deliver better returns than their benchmarks (see my earlier blog on this subject) but the vast majority of investor assets are managed by the 50% of managers who are closet indexers, or the 30% of managers whose portfolios look somewhat like the index.
  • Canada’s market performance is likely to be underwhelming for the next few years. Canada tends to outperform global markets when commodities are rising rapidly but it’s not likely that there will be another ten-fold jump in the price of oil and dramatic increases in gold and commodities anytime soon.
  • The best opportunities for investors today are in U.S. industrials, select European banks and carefully selected Spanish, French, Italian and Greek companies. U.S. industrials will benefit from rising capital expenditures to replace equipment that is older than at any time in the last 60 years and from low natural gas prices as North America moves to energy self-sufficiency. European banks and stocks in the weakest Euro economies are priced for continued recession, and modest growth or even less-bad economic performance will produce dramatic gains in many of these stocks.

Disclaimer: It goes without saying (but I’ll say it anyway) that these ideas are not intended as advice on any specific investment or strategy. Investors should consult their financial professionals before making any investment decisions.

When is 12% not a good return?

When your #PersonalBenchmark earned 16.9%.

Investors are generally happy with their returns for 2013. It was a strong year for most markets, and many portfolios were up by double digits and hitting new highs. Unfortunately, most investors don’t know how to judge the performance of their investments. That’s where #PersonalBenchmarking comes in.

Your #PersonalBenchmark is an investment that you can use to compare your own investment performance with. It should be a strategic asset mix made up of indexes or low-fee Exchange Traded Funds. Here’s an example:

10% BofAML Canada Broad Market 1-5 Yr. TR CAD (short term low risk fixed income)
10% iShares Canadian Universe Bond Index (fixed income)
25% MSCI World GR CAD (global stocks)
20% S&P 500 TR (Bank of Canada) CAD (U.S. Stocks)
35% S&P/TSX Composite TR (Canadian Stocks)

This is a #PersonalBenchmark for growth-oriented investors who invest primarily in equities but who also want some bonds and fixed income to reduce volatility. It increased 16.9% over the 12 months to March 31, 2014. The client couple who use this benchmark earned 17.88% over the same period, after management fees, so we know that the managers who are looking after their portfolio are doing a good job.

Fund Managers With Higher Active Share Ratings Tend to Outperform Benchmarks

‘Active Share’ is a measure of how different a mutual fund is from its benchmark index. I just read a paper about it recently published in the Financial Analysts Journal (Volume 69, Number 4, 2013) of the CFA Institute. The article was written by Antti Petajisto while the author was a finance professor at the NYU Stern School of Business. Among the findings of his study, looking at mutual fund performance in the U.S. from Jan. 1990 to Dec. 2009:

  • There has been an increasing trend over this time period towards ‘closet indexing’ in which actively managed funds look more and more like their index.
  • The average actively managed fund underperformed its benchmark by -0.41% after fees.
  • Closet indexers underperformed by -0.91% after fees.
  • Managers with a high Active Share (> 80%) rating (stock pickers) outperformed by + 0.98% after fees.
  • Of the groups of funds studied, smaller funds within the stock picker group had better outperformance after fees.
  • In the 2008-2009 crisis, stock pickers did better than closet indexers.

Data from statistics and studies can be cherry picked and used to support almost any viewpoint. To me, it makes sense to use both passive low-fee ETFs (or intelligent index funds) and actively managed funds with a high Active Share rating. The argument about whether passive or active management is best will continue, and at times one will come out ahead while in another period the other will win. So it is my view that both have a role in a properly diversified portfolio, and that rebalancing is essential to benefit from the ups and downs of each. But if you are going to use actively managed funds, make sure that the manager is not a closet indexer and that he/she is earning his/her fees with active stock selection. If you would like a copy of the article, email me and I’ll forward it to you.

What do you charge for your services?

Here’s a question I received recently.

“We would like to know what it costs for your services.  We believe you work on a % basis but before we request your service we would like to know what you charge for your services.”

Excellent question! You don’t pay me anything directly. When you invest in mutual funds, compensation for whoever is advising you is built into the management fees. With GICs, the interest rate is set at a level which allows the provider to compensate the broker. In the same way, funds and GICs sold through bank networks include fees to pay overhead and salaries. You may not feel that you are paying anything, because the compensation for everyone working on your behalf is embedded in the structure of the product. The same goes for insurance products.

With mutual funds, all the expenses of the fund are disclosed in the prospectus, which is a document given to you when you invest. What you look for is called a Management Expense Ratio, or MER. This cost may be 1.8% for a bond fund, or 2.5% for an equity fund (a fund that invests in stocks). To simplify a bit, a 2.5% equity fund MER typically pays 1% to the management company that makes the decisions about which stocks to buy or sell, 1% to the investment dealer (HollisWealth, TD, Investors Group, etc.) and .5% for miscellaneous expenses (transaction fees on trades, audit fees, custodial fees, customer service, printing, regulatory fees, etc.)

So if your mutual fund reports that it earned you 10% last year, it actually earned 12.5% but after fees your statement will show that it went up 10%. If the fund reports that it went down 10%, it actually went down only 7.5% but after fees your statement will show a 10% decrease in value. The size of the MER is a factor when I choose a fund for clients, but only one of many. I look for managers who have a long history of outperforming their benchmark index after fees. I would rather have a manager who earned 10% for my client with a 2.5% MER than one who earned 8% with a 2.2% MER. That being said, if two funds have similar risk characteristics, management style and performance, I will tend to choose the one with lower management fees.

The situation changes as your portfolio grows. When the value of household investments exceeds $150,000 we start to look at ‘high-net-worth’ solutions. A portion of the management fees you pay becomes visible and is deducted from your account each month. This fee may be 1/12% of the value of your investments (1% annually), and it allows you to invest in high-net-worth versions of mutual funds that have lower management fees, as well as other low-cost investments. The overall cost (the 1% paid to your investment dealer plus any embedded costs) may be 10-15% lower than traditional mutual funds. As well, the 1% becomes tax deductible for non-registered accounts. When your portfolio gets to be over $1M, there are further decreases in costs.

To summarize, mutual fund investors pay (directly or indirectly) .5% to 1% of their invested assets to their investment dealer, and your advisor gets a portion of that. You also pay 1% or so to the managers who manage your funds, and a smaller amount for miscellaneous costs. As the size of your portfolio grows, your costs of management grow, but typically become a smaller percentage of your portfolio.

All of this is important, because even a small difference in returns translates into significant amounts of money when compounded over long periods. This is not the most important factor, though. Being properly diversified, avoiding common investment mistakes and the quality of ongoing advice and management can have a far greater impact on the success (or not) of your retirement plan.